
Page 3 - Newsletter (Realization of 2019 State Budget & Indonesia’s Position in MLI)
P. 3
DDTC Newsletter Vol.03 | No.01 I January 2020 Page 3 of 7
Realization of 2019 State Budget & Indonesia's
Position in MLI
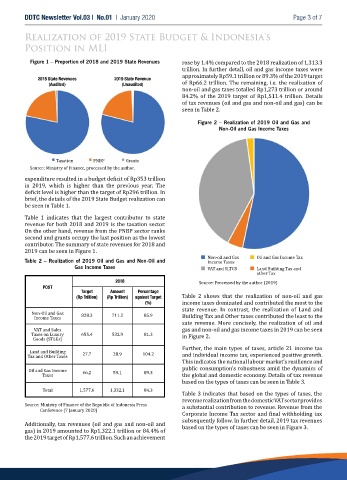
Figure 1 – Proportion of 2018 and 2019 State Revenues rose by 1.4% compared to the 2018 realization of 1,313.3
trillion. In further detail, oil and gas income taxes were
2018 State Revenues 2019 State Revenue approximately Rp59.1 trillion or 89.3% of the 2019 target
(Audited) (Unaudited) of Rp66.2 trillion. The remaining, i.e. the realization of
non-oil and gas taxes totalled Rp1,273 trillion or around
84.2% of the 2019 target of Rp1,511.4 trillion. Details
of tax revenues (oil and gas and non-oil and gas) can be
seen in Table 2.
Figure 2 – Realization of 2019 Oil and Gas and
Non-Oil and Gas Income Taxes
Taxation PNBP Grants
Source: Ministry of Finance, processed by the author.
expenditure resulted in a budget deficit of Rp353 trillion
in 2019, which is higher than the previous year. The
deficit level is higher than the target of Rp296 trillion. In
brief, the details of the 2019 State Budget realization can
be seen in Table 1.
Table 1 indicates that the largest contributor to state
revenue for both 2018 and 2019 is the taxation sector.
On the other hand, revenue from the PNBP sector ranks
second and grants occupy the last position as the lowest
contributor. The summary of state revenues for 2018 and
2019 can be seen in Figure 1.
Table 2 – Realization of 2019 Oil and Gas and Non-Oil and Non-oil and Gas Oil and Gas Income Tax
Income Taxes
Gas Income Taxes VAT and SLTGS Land Building Tax and
other Tax
2018 Source: Processed by the author (2019)
POST
Target Amount Percentage
(Rp Trillion) (Rp Trillion) against Target Table 2 shows that the realization of non-oil and gas
(%) income taxes dominated and contributed the most to the
state revenue. In contrast, the realization of Land and
Non-Oil and Gas
828.3 711.2 85.9 Building Tax and Other taxes contributed the least to the
Income Taxes
sate revenue. More concisely, the realization of oil and
VAT and Sales gas and non-oil and gas income taxes in 2019 can be seen
Taxes on Luxury 655.4 532.9 81.3
in Figure 2.
Goods (STLGs)
Further, the main types of taxes, article 21 income tax
Land and Building
Tax and Other Taxes 27.7 28.9 104.2 and individual income tax, experienced positive growth.
This indicates the national labour market’s resilience and
public consumption’s robustness amid the dynamics of
Oil and Gas Income
66.2 59.1 89.3
Taxes the global and domestic economy. Details of tax revenue
based on the types of taxes can be seen in Table 3.
Total 1,577.6 1,332.1 84.3
Table 3 indicates that based on the types of taxes, the
revenue realization from the domestic VAT sector provides
Source: Ministry of Finance of the Republic of Indonesia Press
a substantial contribution to revenue. Revenue from the
Conference (7 January 2020)
Corporate Income Tax sector and final withholding tax
subsequently follow. In further detail, 2019 tax revenues
Additionally, tax revenues (oil and gas and non-oil and
based on the types of taxes can be seen in Figure 3.
gas) in 2019 amounted to Rp1,322.1 trillion or 84.4% of
the 2019 target of Rp1,577.6 trillion. Such an achievement