
Page 4 - Newsletter (Realization of 2019 State Budget & Indonesia’s Position in MLI)
P. 4
DDTC Newsletter Vol.03 | No.01 I January 2020 Page 4 of 7
Realization of 2019 State Budget & Indonesia's
Position in MLI
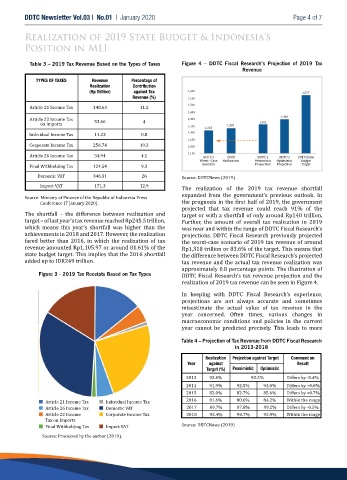
Table 3 – 2019 Tax Revenue Based on the Types of Taxes Figure 4 – DDTC Fiscal Research’s Projection of 2019 Tax
Revenue
TYPES OF TAXES Revenue Percentage of
Realization Contribution
(Rp Trillion) against Tax 1,600 1,577
Revenue (%) 1,550
1,500
Article 21 Income Tax 148.63 11.2
1,450
1,398
Article 22 Income Tax 53.66 4 1,400
on Imports 1,361
1,350 1,332
1,318
1,300
Individual Income Tax 11.23 0.8
1,250
Corporate Income Tax 256.74 19.3
1,200
1,150
Article 26 Income Tax 54.94 4.1
DDTC's 2019 DDTC's DDTC's 2019 State
Worst -Case Realization Pessimistic Optimistic Budget
Scenario Projection Projection Target
Final Withholding Tax 124.54 9.3
Domestic VAT 346.31 26
Source: DDTCNews (2019)
Import VAT 171.3 12.9
The realization of the 2019 tax revenue shortfall
expanded from the government’s previous outlook. In
Source: Ministry of Finance of the Republic of Indonesia Press
Conference (7 January 2020). the prognosis in the first half of 2019, the government
projected that tax revenue could reach 91% of the
The shortfall – the difference between realization and target or with a shortfall of only around Rp140 trillion.
target – of last year’s tax revenue reached Rp245.5 trillion, Further, the amount of overall tax realization in 2019
which means this year’s shortfall was higher than the was near and within the range of DDTC Fiscal Research’s
achievements in 2018 and 2017. However, the realization projections. DDTC Fiscal Research previously projected
fared better than 2016, in which the realization of tax the worst-case scenario of 2019 tax revenue of around
revenue amounted Rp1,105.97 or around 81.61% of the Rp1,318 trillion or 83.6% of the target. This means that
state budget target. This implies that the 2016 shortfall the difference between DDTC Fiscal Research’s projected
added up to IDR249 trillion. tax revenue and the actual tax revenue realization was
approximately 0.8 percentage points. The illustration of
Figure 3 - 2019 Tax Receipts Based on Tax Types
DDTC Fiscal Research’s tax revenue projection and the
realization of 2019 tax revenue can be seen in Figure 4.
In keeping with DDTC Fiscal Research’s experience,
projections are not always accurate and sometimes
misestimate the actual value of tax revenue in the
year concerned. Often times, various changes in
macroeconomic conditions and policies in the current
year cannot be predicted precisely. This leads to more
Table 4 – Projection of Tax Revenue from DDTC Fiscal Research
in 2013-2018
Realization Projection against Target Comment on
Year against Result
Target (%) Pessimistic Optimistic
2013 92.6% 92.2% Differs by -0.4%
2014 91.9% 92.5% 94.0% Differs by +0.6%
2015 82.0% 82.7% 85.6% Differs by +0.7%
2016 81.6% 80.6% 84.2% Within the range
Article 21 Income Tax Individual Income Tax
Article 26 Income Tax Domestic VAT 2017 89.7% 87.8% 89.2% Differs by -0.5%
Article 22 Income Corporate Income Tax 2018 92.4% 90.7% 92.9% Within the range
Tax on Imports
Source: DDTCNews (2019)
Final Withholding Tax Import VAT
Source: Processed by the author (2019).