
Page 11 - Working Paper (The Myths and Realities of Tax Performance Under Semi-Autonomous Revenue Authorities)
P. 11
DDTC Working Paper 0213
11
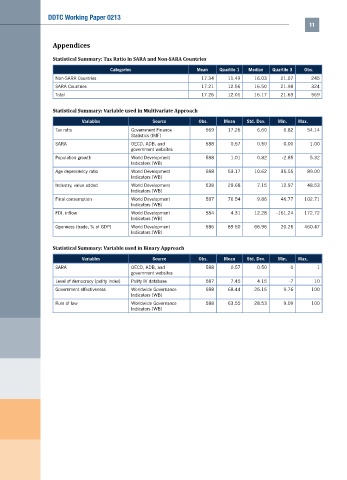
Appendices
Statistical Summary: Tax Ratio in SARA and Non-SARA Countries
Categories Mean Quartile 1 Median Quartile 3 Obs.
Non-SARA Countries 17.34 11.49 16.03 21.07 245
SARA Countries 17.21 12.56 16.50 21.98 324
Total 17.26 12.01 16.17 21.63 569
Statistical Summary: Variable used in Multivariate Approach
Variables Source Obs. Mean Std. Dev. Min. Max.
Tax ratio Government Finance 569 17.26 6.60 6.82 54.14
Statistics (IMF)
SARA OECD, ADB, and 588 0.57 0.50 0.00 1.00
government websites
Population growth World Development 588 1.01 0.82 -2.85 5.32
Indicators (WB)
Age dependency ratio World Development 588 53.17 10.62 35.55 89.00
Indicators (WB)
Industry, value added World Development 538 29.68 7.15 12.97 48.53
Indicators (WB)
Final consumption World Development 587 76.54 9.86 46.77 102.71
Indicators (WB)
FDI, inflow World Development 584 4.31 12.28 -161.24 172.72
Indicators (WB)
Openness (trade, % of GDP) World Development 586 89.50 66.96 20.26 460.47
Indicators (WB)
Statistical Summary: Variable used in Binary Approach
Variables Source Obs. Mean Std. Dev. Min. Max.
SARA OECD, ADB, and 588 0.57 0.50 0 1
government websites
Level of democracy (polity index) Polity IV database 587 7.45 4.15 -7 10
Government effectiveness Worldwide Governance 588 68.44 25.15 9.76 100
Indicators (WB)
Rule of law Worldwide Governance 588 63.55 28.53 9.09 100
Indicators (WB)