
Page 7 - Working Paper (The Myths and Realities of Tax Performance Under Semi-Autonomous Revenue Authorities)
P. 7
DDTC Working Paper 0213
7
lower contribution of income taxes (see Table 1). and pay taxes, where the taxpayer in the country
Moreover, this condition can be interpreted as adopting the model of SARA apparently spent more
limited institutional capacity in collecting taxes. time (367.5 hours) than in countries that adopt a
Tax agencies tend to focus on type of tax that is model of non-SARA (289.2 hours). Both indicators
easier to apply (i.e. sales tax and international show that the SARA model is not always associated
trade). with effectiveness and efficiency of the tax system.
The high intensity of meetings with tax officials
Table 1 - Tax Revenue Structure in SARA and Non- as well as the amount of time spent on tax affairs
SARA Countries (Yearly Average 2000-2011) clearly can also increase the cost of compliance.
However, this can be understood as the stronger
Contribution (% to Number of
Tax Revenue) SARA Non-SARA Observation institutional capacity under SARA models that
require meetings and more detailed tax payments.
Tax on goods and 30.47 31.03 521
services
On the other hand, the existence of tax bribery
Tax on income, 31.15 23.91 529 is more apparent in the countries that adopted
profit, and capital
gains the model of a non-SARA. The evidence shown
by percentage of the company that is expected to
Tax on international 5.07 5.80 428
trades provide ‘gifts’ when meeting with tax officials. In
countries that adopt the model of non-SARA, the
Ratio of direct to 0.88 0.65 428
indirect taxes number reached 28.1%, much larger compared to
what happens in countries that adopted the SARA
Source: Author’s estimation using data from Government Finance
Statistics (IMF), various years. model of which only 19.7%. This may imply that
the tax administration system under SARA models
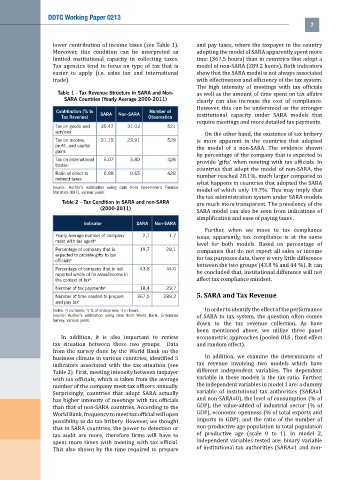
Table 2 - Tax Condition in SARA and non-SARA
(2000-2011) are much more transparent. The prevalency of the
SARA model can also be seen from indications of
simplification and ease of paying taxes .
Indicator SARA Non-SARA
Further, when we move to tax compliance
Yearly average number of company 2,7 1,7 issue, apparently, tax compliance is at the same
meet with tax agent a
level for both models. Based on percentage of
Percentage of company that is 19,7 28,1 companies that do not report all sales or income
expected to provide gifts to tax
officials b for tax purposes data, there is very little difference
between the two groups (43.8 % and 44 %). It can
Percentage of company that is not 43,8 44,0
reported whole of its sales/income in be concluded that, institutional difference will not
the context of tax b affect tax compliance mindset.
Number of tax payments a 18,4 29,7
Number of time needed to prepare 367,5 289,2 5. SARA and Tax Revenue
and pay tax c
Notes: ) numbers; ) % of enterprises; ) in hours. In order to identify the effect of the performance
a
b
c
Source: Author’s estimation using data from World Bank, Enterprise of SARA to tax system, the question often comes
Survey, various years.
down to the tax revenue collection. As have
been mentioned above, we utilize three panel
In addition, it is also important to review econometric approaches (pooled OLS , fixed effect
tax situation between these two groups. Data and random effect).
from the survey done by the World Bank on the
In addition, we examine the determinants of
business climate in various countries, identified 5
tax revenue involving two models which have
indicators associated with the tax situation (see
different independent variables. The dependent
Table 2). First, meeting intensity between taxpayer
variable in these models is the tax ratio. Further,
with tax officials, which is taken from the average
the independent variables in model 1 are: a dummy
number of the company meet tax officers annually.
variable of institutional tax authorities (SARA=1
Surprisingly, countries that adopt SARA actually
and non-SARA=0), the level of consumption (% of
has higher intensity of meetings with tax officials
GDP), the value-added of industrial sector (% of
than that of non-SARA countries. According to the
GDP), economic openness (% of total exports and
World Bank, frequency to meet tax official will open
imports to GDP), and the ratio of the number of
possibility to do tax bribery. However, we thought
non-productive age population to total population
that in SARA countries, the power to detection or
of productive age (scale 0 to 1). In model 2,
tax audit are more, therefore firms will have to
independent variables tested are: binary variable
spent more times with meeting with tax official.
of institutional tax authorities (SARA=1 and non-
This also shown by the time required to prepare