Page 10 - Working Paper (Fiscal Decentralization and Sub-national Taxes: Specific Case of Indonesia)
P. 10

DDTC Working Paper 1015
                                                                                                           10


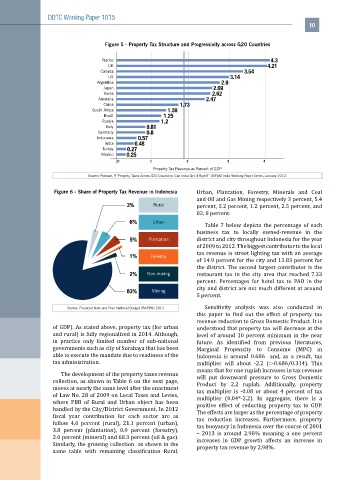
                                     Figure 5 - Property Tax Structure and Progressivity across G20 Countries

                                    France                                                    4.3
                                      UK                                                     4.21
                                    Canada                                           3.54
                                      US                                        3.14
                                  Argentina                                  2.9
                                    Japan                                 2.69
                                     Korea                                2.62
                                   Australia                            2.47
                                     China                     1.73
                                 South Africa              1.39
                                     Brazil              1.25
                                    Russia              1.2
                                     Italy         0.81
                                   Germany         0.8
                                  Indonesia     0.57
                                     India     0.48
                                    Turkey   0.27
                                    Mexico  0.25
                                         0          1            2             3           4
                                                      Property Tax Revenue as Percent of GDP
                               Source: Prakash, P,”Property Taxes Across G20 Countries: Can India Get it Right?” OXFAM India Working Paper Series, January 2013.

                    Figure 6 - Share of Property Tax Revenue in Indonesia  Urban,  Plantation,  Forestry,  Minerals  and  Coal
                                                                    and Oil and Gas Mining respectively 3 percent, 5.4
                                             3%       Rural         percent, 5.2 percent, 1.2 percent, 2.5 percent, and
                                                                    82, 8 percent.
                                              6%     Urban
                                                                       Table  7 below depicts  the percentage of  each
                                                                    business  tax  to locally owned-revenue in the
                                              5%    Plantation      district and city throughout Indonesia for the year
                                                                    of 2009 to 2012. The biggest contributor to the local
                                              1%     Forestry       tax revenue is street lighting tax with an average
                                                                    of 14.9 percent for the city and 12.83 percent for
                                                                    the district. The second largest contributor is the
                                              2%   Non-mining       restaurant tax  in the city area that reached  7.33
                                                                    percent.  Percentages  for  hotel  tax  to  PAD  in  the
                                             83%     Mining         city and district are not much different at around
                                                                    5 percent.

                        Source: Financial Note and Plan National Budget (RAPBN) 2014  Sensitivity  analysis  was  also  conducted  in
                                                                    this  paper  to  find  out  the  effect  of  property  tax
                                                                    revenue reduction to Gross Domestic Product. It is
                   of GDP). As stated above, property tax (for urban   understood that property tax will decrease at the
                   and rural) is fully regionalized in 2014. Although,   level of around 10 percent minimum in the near
                   in practice only limited  number of  sub-national   future.  As  identified  from  previous  literatures,
                   governments such as city of Surabaya that has been   Marginal  Propensity  to  Consume  (MPC)  in
                   able to execute the mandate due to readiness of the   Indonesia is around 0.686    and,  as  a  result,  tax
                   tax administration.                              multiplier  will  about  -2.2  (=-0.686/0.314).  This
                                                                    means that for one rupiah increases in tax revenue
                      The development of the property taxes revenue
                                                                    will  put  downward  pressure  to  Gross  Domestic
                   collection, as shown in Table 6 on the next page,
                                                                    Product by 2.2 rupiah. Additionally, property
                   moves at nearly the same level after the enactment
                                                                    tax  multiplier  is -0.08  or  about  4 percent of tax
                   of Law No. 28 of 2009 on Local Taxes and Levies,
                                                                    multiplier  (0.04*-2.2).  In aggregate, there is a
                   where  PBB  of  Rural  and  Urban  object  has  been
                                                                    positive  effect  of  reducting  property  tax  to  GDP.
                   handled by the City/District Government. In 2012
                                                                    The effects are larger as the percentage of property
                   fiscal  year  contribution  for  each  sector  are  as
                                                                    tax  reduction  increases. Furthermore, property
                   follow 4.0  percent (rural),  21.1  percent (urban),
                                                                    tax buoyancy in Indonesia over the course of 2001
                   3.8 percent (plantation),  0.9  percent (forestry),
                                                                    –  2013  is  around  2.98%  meaning  a  one  percent
                   2.0 percent (mineral) and 68.3 percent (oil & gas).
                                                                    increases  in  GDP  growth  affects  an  increase  in
                   Similarly, the growing collection  as shown in the
                                                                    property tax revenue by 2.98%.
                   same  table  with  remaining  classification  Rural,
   5   6   7   8   9   10   11   12