
Page 11 - Working Paper (Fiscal Decentralization and Sub-national Taxes: Specific Case of Indonesia)
P. 11
DDTC Working Paper 1015
11
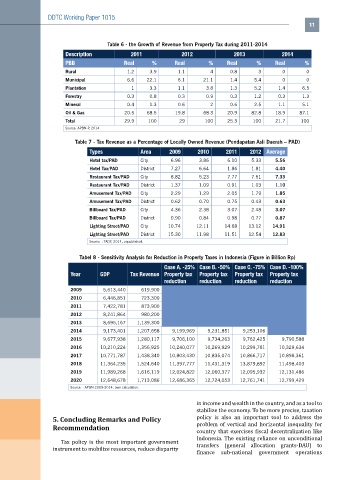
Table 6 - the Growth of Revenue from Property Tax during 2011-2014
Description 2011 2012 2013 2014
PBB Real % Real % Real % Real %
Rural 1.2 3.9 1.1 4 0.8 3 0 0
Municipal 6.6 22.1 6.1 21.1 1.4 5.4 0 0
Plantation 1 3.3 1.1 3.8 1.3 5.2 1.4 6.5
Forestry 0.3 0.8 0.3 0.9 0.3 1.2 0.3 1.3
Mineral 0.4 1.3 0.6 2 0.6 2.5 1.1 5.1
Oil & Gas 20.5 68.5 19.8 68.3 20.9 82.8 18.9 87.1
Total 29.9 100 29 100 25.3 100 21.7 100
Source: APBN-P, 2014
Table 7 - Tax Revenue as a Percentage of Locally Owned Revenue (Pendapatan Asli Daerah – PAD)
Types Area 2009 2010 2011 2012 Average
Hotel tax/PAD City 6.96 3.86 6.10 5.33 5.56
Hotel Tax/PAD District 7.27 6.64 1.86 1.81 4.40
Restaurant Tax/PAD City 8.82 5.23 7.77 7.51 7.33
Restaurant Tax/PAD District 1.37 1.09 0.91 1.03 1.10
Amusement Tax/PAD City 2.29 1.29 2.05 1.79 1.85
Amusement Tax/PAD District 0.62 0.70 0.75 0.43 0.63
Billboard Tax/PAD City 4.36 2.38 3.07 2.48 3.07
Billboard Tax/PAD District 0.90 0.84 0.98 0.77 0.87
Lighting Street/PAD City 10.74 12.11 14.68 13.12 14.91
Lighting Street/PAD District 15.30 11.98 11.51 12.54 12.83
Source: : TADF, 2014, unpublished.
Tabel 8 - Sensitivity Analysis for Reduction in Property Taxes in Indonesia (Figure in Billion Rp)
Case A. -25% Case B. -50% Case C. -75% Case D. -100%
Year GDP Tax Revenue Property tax Property tax Property tax Property tax
reduction reduction reduction reduction
2009 5,613,440 619,900
2010 6,446,851 723,300
2011 7,422,781 873,900
2012 8,241,864 980,200
2013 8,695,167 1,139,300
2014 9,173,401 1,207,658 9,199,969 9,231,851 9,253,106
2015 9,677,938 1,280,117 9,706,100 9,734,263 9,762,425 9,790,588
2016 10,210,224 1,356,925 10,240,077 10,269,929 10,299,781 10,329,634
2017 10,771,787 1,438,340 10,803,430 10,835,074 10,866,717 10,898,361
2018 11,364,235 1,524,640 11,397,777 11,431,319 13,879,892 11,498,403
2019 11,989,268 1,616,119 12,024,822 12,060,377 12,095,932 12,131,486
2020 12,648,678 1,713,086 12,686,365 12,724,053 12,761,741 12,799,429
Source: : APBN 2009-2014, own calculation.
in income and wealth in the country, and as a tool to
stabilize the economy. To be more precise, taxation
5. Concluding Remarks and Policy policy is also an important tool to address the
Recommendation problem of vertical and horizontal inequality for
country that exercises fiscal decentralization like
Indonesia. The existing reliance on unconditional
Tax policy is the most important government
transfers (general allocation grants-DAU) to
instrument to mobilize resources, reduce disparity
finance sub-national government operations