
Page 6 - Working Paper (Analysis of Political Budget Cycles in Emerging South East Asian Economies)
P. 6
DDTC Working Paper 0414 DDTC Working Paper 0414
6
5. Econometric Results As earlier mentioned, the full sample period
runs from 1985 to 2011. Relationship of variable
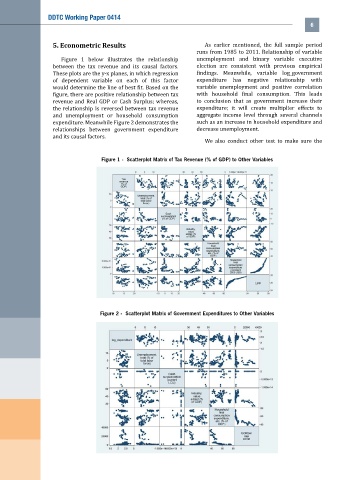
Figure 1 below illustrates the relationship unemployment and binary variable executive
between the tax revenue and its causal factors. election are consistent with previous empirical
These plots are the y-x planes, in which regression findings. Meanwhile, variable log_government
of dependent variable on each of this factor expenditure has negative relationship with
would determine the line of best fit. Based on the variable unemployment and positive correlation
figure, there are positive relationship between tax with household final consumption. This leads
revenue and Real GDP or Cash Surplus; whereas, to conclusion that as government increase their
the relationship is reversed between tax revenue expenditure; it will create multiplier effects to
and unemployment or household consumption aggregate income level through several channels
expenditure. Meanwhile Figure 2 demonstrates the such as an increase in household expenditure and
relationships between government expenditure decrease unemployment.
and its causal factors.
We also conduct other test to make sure the
Figure 1 - Scatterplot Matrix of Tax Revenue (% of GDP) to Other Variables
Figure 2 - Scatterplot Matrix of Government Expenditures to Other Variables