
Page 8 - Working Paper (Analysis of Political Budget Cycles in Emerging South East Asian Economies)
P. 8
DDTC Working Paper 0414 DDTC Working Paper 0414
8
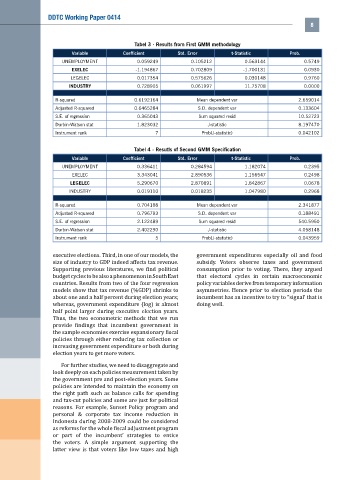
Tabel 3 - Results from First GMM methodology
Variable Coefficient Std. Error t-Statistic Prob.
UNEMPLOYMENT 0.059249 0.105212 0.563144 0.5749
EXELEC -1.194867 0.702809 -1.700131 0.0930
LEGELEC 0.017354 0.575626 0.030148 0.9760
INDUSTRY 0.728905 0.061997 11.75708 0.0000
R-squared 0.6192164 Mean dependent var 2.659014
Adjusted R-squared 0.6465284 S.D. dependent var 0.133604
S.E. of regression 0.365043 Sum squared resid 10.52723
Durbin-Watson stat 1.823032 J-statistic 8.197470
Instrument rank 7 Prob(J-statistic) 0.042102
Tabel 4 - Resutls of Second GMM Specification
Variable Coefficient Std. Error t-Statistic Prob.
UNEMPLOYMENT 0.336411 0.284594 1.182074 0.2395
EXELEC 3.343041 2.890536 1.156547 0.2498
LEGELEC 5.290670 2.870891 1.842867 0.0678
INDUSTRY 0.019110 0.018235 1.047980 0.2968
R-squared 0.704188 Mean dependent var 2.341877
Adjusted R-squared 0.796793 S.D. dependent var 0.188491
S.E. of regression 2.122489 Sum squared resid 540.5950
Durbin-Watson stat 2.402290 J-statistic 4.058148
Instrument rank 5 Prob(J-statistic) 0.043959
executive elections. Third, in one of our models, the government expenditures especially oil and food
size of industry to GDP indeed affects tax revenue. subsidy. Voters observe taxes and government
Supporting previous literatures, we find political consumption prior to voting. There, they argued
budget cycles to be also a phenomenon in South East that electoral cycles in certain macroeconomic
countries. Results from two of the four regression policy variables derive from temporary information
models show that tax revenue (%GDP) shrinks to asymmetries. Hence prior to election periods the
about one and a half percent during election years; incumbent has an incentive to try to “signal’ that is
whereas, government expenditure (log) is almost doing well.
half point larger during executive election years.
Thus, the two econometric methods that we run
provide findings that incumbent government in
the sample economies exercise expansionary fiscal
policies through either reducing tax collection or
increasing government expenditure or both during
election years to get more voters.
For further studies, we need to disaggregate and
look deeply on each policies measurement taken by
the government pre and post-election years. Some
policies are intended to maintain the economy on
the right path such as balance calls for spending
and tax-cut policies and some are just for political
reasons. For example, Sunset Policy program and
personal & corporate tax income reduction in
Indonesia during 2008-2009 could be considered
as reforms for the whole fiscal adjustment program
or part of the incumbent’ strategies to entice
the voters. A simple argument supporting the
latter view is that voters like low taxes and high