
Page 7 - Working Paper (Analysis of Political Budget Cycles in Emerging South East Asian Economies)
P. 7
DDTC Working Paper 0414 DDTC Working Paper 0414
7
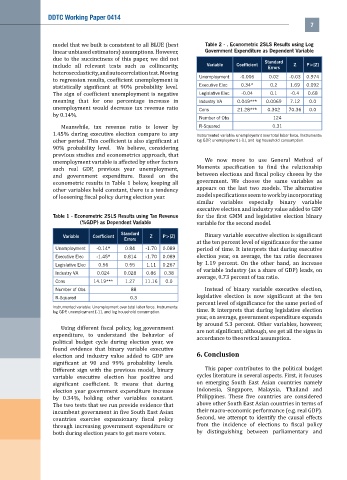
model that we built is consistent to all BLUE (best Table 2 - . Econometric 2SLS Results using Log
Government Expenditure as Dependent Variable
linear unbiased estimators) assumptions. However,
due to the succinctness of this paper, we did not Standard
include all relevant tests such as collinearity, Variable Coefficient Errors Z P>[Z]
heteroscedasticity, and autocorrelation test. Moving
Unemployment -0.006 0.02 -0.03 0.974
to regression results, coefficient unemployment is
Executive Elec 0.34* 0.2 1.69 0.092
statistically significant at 90% probability level.
The sign of coefficient unemployment is negative Legislative Elec -0.04 0.1 -0.4 0.68
meaning that for one percentage increase in Industry VA 0.049*** 0.0069 7.12 0.0
unemployment would decrease tax revenue ratio Cons 21.28*** 0.302 70.36 0.0
by 0.14%.
Number of Obs 124
Meanwhile, tax revenue ratio is lower by R-Squared 0.31
1.45% during executive election compare to any Instrumented variable: unemployemnt over total labor force. Instruments:
other period. This coefficient is also significant at log GDP, unemployment [-1], and log household consumption.
90% probability level. We believe, considering
previous studies and econometrics approach, that
We now move to use General Method of
unemployment variable is affected by other factors
Moments specification to find the relationship
such real GDP, previous year unemployment,
between elections and fiscal policy chosen by the
and government expenditure. Based on the
government. We choose the same variables as
econometric results in Table 1 below, keeping all
appears on the last two models. The alternative
other variables held constant, there is a tendency
model specifications seem to work by incorporating
of loosening fiscal policy during election year.
similar variables especially binary variable
executive election and industry value added to GDP
Table 1 - Econometric 2SLS Results using Tax Revenue for the first GMM and legislative election binary
(%GDP) as Dependent Variable variable for the second model.
Standard
Variable Coefficient Z P>[Z] Binary variable executive election is significant
Errors
at the ten percent level of significance for the same
Unemployment -0.14* 0.84 -1.70 0.089 period of time. It interprets that during executive
Executive Elec -1.45* 0.814 -1.70 0.089 election year, on average, the tax ratio decreases
Legislative Elec 0.56 0.55 1.11 0.267 by 1.19 percent. On the other hand, an increase
Industry VA 0.024 0.028 0.86 0.38 of variable industry (as a share of GDP) leads, on
average, 0.73 percent of tax ratio.
Cons 14.19*** 1.27 11.16 0.0
Number of Obs 88 Instead of binary variable executive election,
R-Squared 0.3 legislative election is now significant at the ten
percent level of significance for the same period of
Instrumented variable: Unemployment over total labor force. Instruments:
log GDP, unemployment [-1], and log household consumption. time. It interprets that during legislative election
year, on average, government expenditure expands
by around 5.3 percent. Other variables, however,
Using different fiscal policy, log_government
are not significant; although, we get all the signs in
expenditure, to understand the behavior of
accordance to theoretical assumption.
political budget cycle during election year, we
found evidence that binary variable executive 6. Conclusion
election and industry value added to GDP are
significant at 90 and 99% probability levels.
Different sign with the previous model, binary This paper contributes to the political budget
variable executive election has positive and cycles literature in several aspects. First, it focuses
significant coefficient. It means that during on emerging South East Asian countries namely
election year government expenditure increase Indonesia, Singapore, Malaysia, Thailand and
by 0.34%, holding other variables constant. Philippines. These five countries are considered
The two tests that we run provide evidence that above other South East Asian countries in terms of
incumbent government in five South East Asian their macro-economic performance (e.g. real GDP).
countries exercise expansionary fiscal policy Second, we attempt to identify the causal effects
through increasing government expenditure or from the incidence of elections to fiscal policy
both during election years to get more voters. by distinguishing between parliamentary and