
Page 10 - Working Paper (Narrowing Tax Gap: Cross Countries Experience)
P. 10
DDTC Working Paper 0915
10
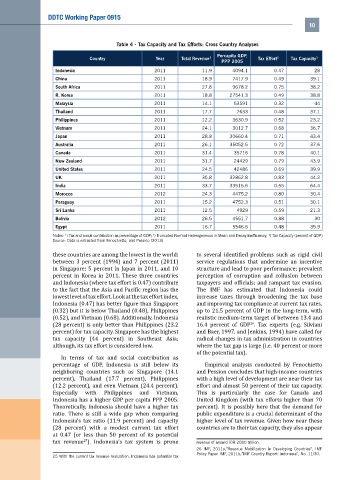
Table 4 - Tax Capacity and Tax Efforts: Cross Country Analyses
Percapita GDP,
Country Year Total Revenue 1 Tax Effort 2 Tax Capacity 3
PPP 2005
Indonesia 2011 11.9 4094.1 0.47 28
China 2011 18.9 7417.9 0.49 39.1
South Africa 2011 27.8 9678.2 0.75 38.2
R. Korea 2011 18.8 27541.3 0.49 38.8
Malaysia 2011 14.1 53591 0.32 44
Thailand 2011 17.7 7633 0.48 37.1
Philippines 2011 12.2 3630.9 0.52 23.2
Vietnam 2011 24.1 3012.7 0.68 36.7
Japan 2011 28.8 30660.4 0.71 43.4
Australia 2011 26.1 35052.5 0.72 37.6
Canada 2011 31.4 35716 0.78 40.1
New Zealand 2011 31.7 24429 0.79 43.9
United States 2011 24.5 42486 0.69 39.9
UK 2011 35.8 32862.8 0.83 44.2
India 2011 33.7 33515.6 0.55 64.4
Morocco 2012 24.3 4475.2 0.80 30.4
Paraguay 2011 15.2 4752.3 0.51 30.1
Sri Lanka 2011 12.5 4929 0.59 21.3
Bolivia 2012 26.5 4551.7 0.88 30
Egypt 2011 16.7 5546.5 0.48 35.9
Notes: ) Tax and social contribution as percentage of GDP; ) Truncated Normal Heterogeneous in Mean and Decay Inefficiency; ) Tax Capacity (percent of GDP)
2
1
3
Source: Data is extracted from Fenochietto, and Pessino (2013)
these countries are among the lowest in the world: to several identified problems such as rigid civil
between 3 percent (1994) and 7 percent (2011) service regulations that undermine an incentive
in Singapore; 5 percent in Japan in 2011, and 10 structure and lead to poor performance; prevalent
percent in Korea in 2011. These three countries perception of corruption and collusion between
and Indonesia (where tax effort is 0.47) contribute taxpayers and officials; and rampant tax evasion.
to the fact that the Asia and Pacific region has the The IMF has estimated that Indonesia could
lowest level of tax effort. Look at the tax effort index, increase taxes through broadening the tax base
Indonesia (0.47) has better figure than Singapore and improving tax compliance at current tax rates,
(0.32) but it is below Thailand (0.48), Philippines up to 21.5 percent of GDP in the long-term, with
(0.52), and Vietnam (0.68). Additionally, Indonesia realistic medium-term target of between 13.4 and
26
(28 percent) is only better than Philippines (23.2 16.4 percent of GDP . Tax experts (e.g. Silviani
percent) for tax capacity. Singapore has the highest and Baer, 1997, and Jenkins, 1994) have called for
tax capacity (44 percent) in Southeast Asia; radical changes in tax administration in countries
although, its tax effort is considered low. where the tax gap is large (i.e. 40 percent or more
of the potential tax).
In terms of tax and social contribution as
percentage of GDP, Indonesia is still below its Empirical analysis conducted by Fenochietto
neighboring countries such as Singapore (14.1 and Pession concludes that high-income countries
percent), Thailand (17.7 percent), Philippines with a high level of development are near their tax
(12.2 percent), and even Vietnam (24.4 percent). effort and almost 50 percent of their tax capacity.
Especially with Philippines and Vietnam, This is particularly the case for Canada and
Indonesia has a higher GDP per capita PPP 2005. United Kingdom (with tax efforts higher than 70
Theoretically, Indonesia should have a higher tax percent). It is possibly here that the demand for
ratio. There is still a wide gap when comparing public expenditure is a crucial determinant of the
Indonesia’s tax ratio (11.9 percent) and capacity higher level of tax revenue. Given how near these
(28 percent) with a modest current tax effort countries are to their tax capacity, they also appear
at 0.47 (or less than 50 percent of its potential
25
tax revenue ). Indonesia’s tax system is prone revenue of around IDR 2000 trillion.
26 IMF, 2011a,”Revenue Mobilization in Developing Countries”, IMF
Policy Paper. IMF, 2011b,”IMF Country Report: Indonesia”, No. 11/30.
25 With the current tax revenue realization, Indonesia has potential tax