
Page 6 - Working Paper (Narrowing Tax Gap: Cross Countries Experience)
P. 6
DDTC Working Paper 0915
6
3. Tax Capacity and Tax Effort:
difference between the total cost of labor in the
official economy and the after-tax earnings from Comparative Studies
work, the greater the incentive for workers to move
to the shadow economy. Several studies have found TAx CApACiTy ANd EfforTs
strong evidence that the tax regime and types of tax prEsENT siGNifiCANT
administration influence the decision of taxpayers dEviATioNs ACross CouNTriEs,
to work in formal or informal sectors. With evasion iNComE Groups ANd rEGioNs,
being such as a dominant issue, countries face
additional pressure to lower tax rates, as the main As wEll As ovErTimE.
tool, in order to draw individuals and firms into the
formal economy and to dis-incentive those already
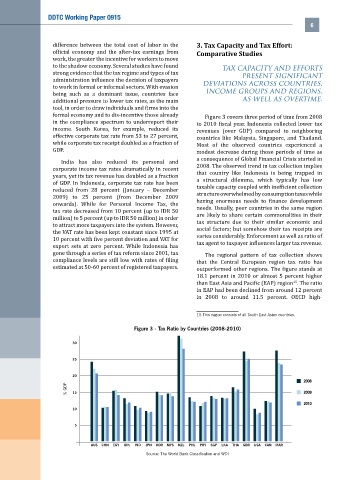
Figure 3 covers three period of time from 2008
in the compliance spectrum to underreport their
to 2010 fiscal year. Indonesia collected lower tax
income. South Korea, for example, reduced its
revenues (over GDP) compared to neighboring
effective corporate tax rate from 53 to 27 percent,
countries like Malaysia, Singapore, and Thailand.
while corporate tax receipt doubled as a fraction of
Most of the observed countries experienced a
GDP.
modest decrease during those periods of time as
a consequence of Global Financial Crisis started in
India has also reduced its personal and
2008. The observed trend in tax collection implies
corporate income tax rates dramatically in recent
that country like Indonesia is being trapped in
years, yet its tax revenue has doubled as a fraction
a structural dilemma, which typically has low
of GDP. In Indonesia, corporate tax rate has been
taxable capacity coupled with inefficient collection
reduced from 28 percent (January – December
structure overwhelmed by consumption taxes while
2009) to 25 percent (from December 2009
having enormous needs to finance development
onwards). While for Personal Income Tax, the
needs. Usually, peer countries in the same region
tax rate decreased from 10 percent (up to IDR 50
are likely to share certain commonalities in their
million) to 5 percent (up to IDR 50 million) in order
tax structure due to their similar economic and
to attract more taxpayers into the system. However,
social factors; but somehow their tax receipts are
the VAT rate has been kept constant since 1995 at
varies considerably. Enforcement as well as ratio of
10 percent with five percent deviation and VAT for
tax agent to taxpayer influences larger tax revenue.
export sets at zero percent. While Indonesia has
gone through a series of tax reform since 2001, tax The regional pattern of tax collection shows
compliance levels are still low with rates of filing that the Central European region tax ratio has
estimated at 50-60 percent of registered taxpayers. outperformed other regions. The figure stands at
18.1 percent in 2010 or almost 5 percent higher
15
than East Asia and Pacific (EAP) region . The ratio
in EAP had been declined from around 12 percent
in 2008 to around 11.5 percent. OECD high-
15 This region consists of all South East Asian countries.
Figure 3 - Tax Ratio by Countries (2008-2010)
30
25
20
2008
% GDP 15 2009
2010
10
5
AUS CHN EGY IDN IND JPN KOR MYS NZL PHL PRY SGP LKA THA GBR USA CAN MAR
Source: The World Bank Classification and WDI