
Page 9 - Working Paper (Narrowing Tax Gap: Cross Countries Experience)
P. 9
DDTC Working Paper 0915
9
equals predicted tax capacity. Countries above the on its tax policies and administrations. 23
45-degree line are the ones with a high tax effort
Table 3 - Summary of Several Countries by Tax Effort
(actual taxes are higher than predicted taxes).
Index (Average 1994-2009)
Conversely, the countries located below the line
are the one collecting below their tax capacity.
Country Tax Effort
Most of developed countries are on and above the
45-degree line.
Indonesia 0.9
China 0.48
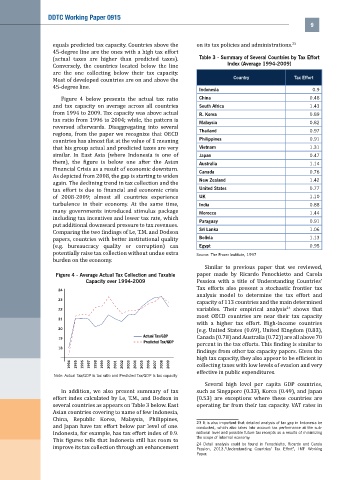
Figure 4 below presents the actual tax ratio
and tax capacity on average across all countries South Africa 1.43
from 1994 to 2009. Tax capacity was above actual R. Korea 0.89
tax ratio from 1996 to 2004; while, the pattern is Malaysia 0.82
reversed afterwards. Disaggregating into several
Thailand 0.97
regions, from the paper we recognize that OECD
Philippines 0.91
countries has almost flat at the value of 1 meaning
that his group actual and predicted taxes are very Vietnam 1.31
similar. In East Asia (where Indonesia is one of Japan 0.47
them), the figure is below one after the Asian Australia 1.14
Financial Crisis as a result of economic downturn. Canada 0.76
As depicted from 2008, the gap is starting to widen
New Zealand 1.42
again. The declining trend in tax collection and the
United States 0.77
tax effort is due to financial and economic crisis
of 2008-2009; almost all countries experience UK 1.10
turbulence in their economy. At the same time, India 0.88
many governments introduced stimulus package Morocco 1.44
including tax incentives and lower tax rate, which
Paraguay 0.91
put additional downward pressure to tax revenues.
Sri Lanka 1.06
Comparing the two findings of Le, T.M. and Dodson
Bolivia 1.13
papers, countries with better institutional quality
(e.g. bureaucracy quality or corruption) can Egypt 0.95
potentially raise tax collection without undue extra Source: The Frazer Institute, 1997
burden on the economy.
Similar to previous paper that we reviewed,
Figure 4 - Average Actual Tax Collection and Taxable paper made by Ricardo Fenochietto and Carola
Capacity over 1994-2009 Pession with a title of Understanding Countries’
24 Tax efforts also present a stochastic frontier tax
analysis model to determine the tax effort and
23
capacity of 113 countries and the main determined
22 variables. Their empirical analysis shows that
24
most OECD countries are near their tax capacity
21
with a higher tax effort. High-income countries
20
(e.g. United States (0.69), United Kingdom (0.83),
Actual Tax/GDP
19 Canada (0.78) and Australia (0.72)) are all above 70
Predicted Tax/GDP
18 percent in the tax efforts. This finding is similar to
findings from other tax capacity papers. Given the
high tax capacity, they also appear to be efficient in
1994 1995 1996 1997 1998 1999 2000 2001 2002 2003 2004 2005 2006 2007 2008 2009 collecting taxes with low levels of evasion and very
effective in public expenditures.
Note: Actual Tax/GDP is tax ratio and Predicted Tax/GDP is tax capacity
Several high level per capita GDP countries,
In addition, we also present summary of tax such as Singapore (0.33), Korea (0.49), and Japan
effort index calculated by Le, T.M., and Dodson in (0.53) are exceptions where these countries are
several countries as appears on Table 3 below. East operating far from their tax capacity. VAT rates in
Asian countries covering to name of few Indonesia,
China, Republic Korea, Malaysia, Philippines,
23 It is also important that detailed analysis of tax gap in Indonesia be
and Japan have tax effort below par level of one. conducted, which also takes into account tax performance at the sub-
Indonesia, for example, has tax effort index of 0.9. national level and possible future tax receipts as a results of minimizing
the scope of informal economy.
This figures tells that Indonesia still has room to
24 Detail analysis could be found in Fenochietto, Ricardo and Carola
improve its tax collection through an enhancement Pession, 2013,”Understanding Countries’ Tax Effort”, IMF Working
Paper.