
Page 7 - Working Paper (Narrowing Tax Gap: Cross Countries Experience)
P. 7
DDTC Working Paper 0915
7
income countries have the highest tax collection as indicates that countries with better institutional
percentage of GDP at around 30 percent in 2010. quality (e.g., bureaucracy quality or corruption)
Moreover, the tax share in the Latin America and can potentially raise tax collection without undue
Caribbean region, the Sub-Saharan Africa region, extra burden on the economy.
and the Middle East and North Africa region
present similar tax ratio at around 18 percent of Tax capacity and efforts present significant
GDP. deviations across countries, income groups and
regions, as well as overtime. But overall, developing
Measuring taxation performance of countries is countries seem to have more limitations to expand
useful but theoretically and practically challenging. the scope for taxation, which is determined by their
As presented in the empirical analysis, several taxable capacity. On the one hand, countries with a
variables are important in determining the level of low level of actual tax collection and low tax effort
taxes in a country. It is worth noting that in recent may have more room to increase tax revenues
years both the significance and the magnitude of in order to reach their taxable capacity without
the impact of institutional quality indexes on tax causing major economic distortions or costs. On
collection have increased strongly. This finding the other hand, low-income countries with a low
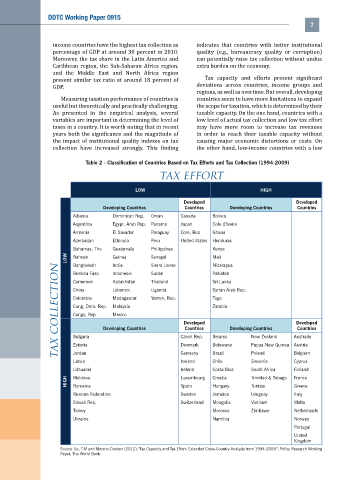
Table 2 - Classification of Countries Based on Tax Efforts and Tax Collection (1994-2009)
TAx EfforT
LOW HIGH
Developed Developed
Developing Countries Countries Developing Countries Countries
Albania Dominican Rep. Oman Canada Bolivia
Argentina Egypt. Arab Rep. Panama Japan Cote d’Ivoire
Armenia El Savador Paraguay Core, Rep Ghana
Azerbaijan Ethiopia Peru United States Honduras
Bahamas, The Guatemala Philippines Kenya
LOW Bahrain Guinea Senegal Mali
TAx CollECTioN China Developing Countries Uganda Developed Syrian Arab Rep. Developed
Sierra Leone
India
Bangladesh
Nicaragua
Burkina Faso
Indonesia
Sudan
Pakistan
Sri Lanka
Thailand
Kazakhstan
Cameroon
Lebanon
Madagascar
Yemen, Rep.
Colombia
Togo
Malaysia
Cong, Dem. Rep.
Zambia
Mexico
Congo, Rep
Developing Countries
Countries
Countries
Bulgaria
Botswana
Papua New Guinea
Austria
Estonia
Denmark
Poland
Germany
Brazil
Jordan
Belgium
Chile
Cyprus
Slovenia
Latvia Czech Rep. Belarus New Zealand Australia
Iceland
Lithuania Ireland Costa Rica South Africa Finland
HIGH Moldova Luxembourg Croatia Trinidad & Tobago France
Tunisia
Spain
Hungary
Greece
Romania
Russian Federation Sweden Jamaica Uruguay Italy
Slovak Rep. Switzerland Mongolia Vietnam Malta
Turkey Morocco Zimbawe Netherlands
Ukraine Namibia Norway
Portugal
United
Kingdom
Source: Le, T.M and Moreno-Dodson (2012),”Tax Capacity and Tax Effort: Extended Cross-Country Analysis from 1994-2009”, Policy Research Working
Paper, The World Bank.